Co-Training Implementation - Objectivity Detection with R
Data analytics project in R to create a predictive model for the detection of objectivity in sports articles, based on co-training.
| Paper | Proposal | Code |
Abstract
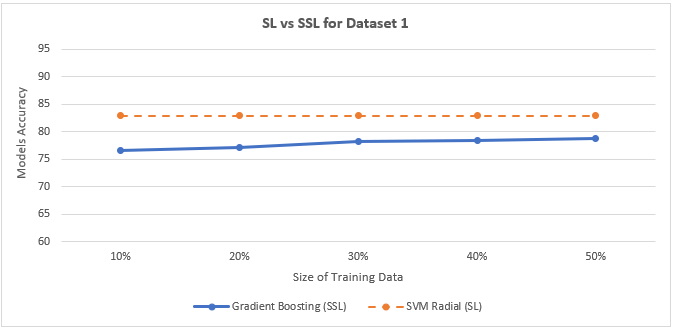
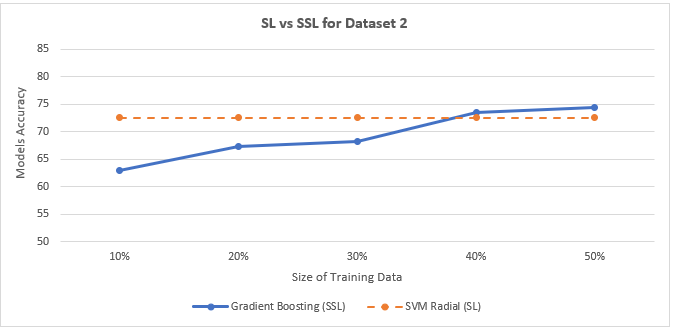
Currently, many sports articles are published daily on the Internet, by various authors, which are often written objectively, on other occasions subjectively, which may not please the reader or change your perception of the facts. In the present work, we perform a detection analysis of objectivity to a set of 1000 sports articles, previously labeled using the Mechanical Turk tool from Amazon. For this, we conducted 2 experiments in which the predictive ability of using trained statistical models with supervised versus trained learning with semi-supervised learning was compared. The fact of learning from the original file tagged by Amazon Mechanical Turk and one generated with the TMG+ algorithm based on TF-IDF was also evaluated. The results obtained were very encouraging, since the SL approach generated better results for the original tagged file (precision close to 82.9%), while the SSL approach using Co-Training, generated better results for the dataset created with the own algorithm, with accuracy close to 74.4% using 50% of the data tagged for SSL.
Data
In this project we use two views of the same data, called dataset 1 and dataset 2:
Dataset 1
This dataset has two kinds of files, sports articles and features of the same sports articles. The sports articles are 1000 text files, where each of them contains one sport article in a raw format. The features file is an excel file composed of a thousand records/rows where each of them correspond to one of the sport articles mentioned before, it is also composed of a series of attributes (59) and a label that states if the article is objective or not.
The 1000 sports articles were labeled using Amazon Mechanical Turk as objective or subjective. The raw texts, extracted features, and the URLs from which the articles were retrieved are provided.
Dataset 2
Two datasets were created from the raw data (the 1000 sport articles) using term frequency–inverse document frequency (TFIDF) technique in Python. The difference between them is that one of them was processed with stemming. These datasets are CSV files composed of 5742 and 5231 attributes for simple and stemmed version respectively, these numbers are variable because attributes are auto-generated by the Term Matrix Generator process.
Results
Below some results obtained in this paper. For more detail, please read the full paper.
Experiment 1 – SL vs SSL for Dataset 1
Average precision of the models for experiment 1 - second scenario:
| Model | Accuracy | Error | # Objective | # Subjective | % Objective | % Subjective |
|---|---|---|---|---|---|---|
| Base Line | 63.50 | 36.50 | 635 | 365 | 100.00 | 100.00 |
| Naive Bayes | 79.90 | 20.10 | 567 | 232 | 89.29 | 63.56 |
| SVM Linear | 83.40 | 16.60 | 583 | 251 | 91.75 | 68.88 |
| SVM Poly | 73.53 | 26.47 | 497 | 238 | 78.33 | 65.18 |
| Random Forest 200 | 82.89 | 17.11 | 557 | 272 | 87.78 | 74.38 |
| Random Forest 300 | 82.75 | 17.25 | 558 | 270 | 87.81 | 73.95 |
| Ada Boost | 81.04 | 18.96 | 545 | 265 | 85.86 | 72.66 |
Gradient Boosting Accuracy with Co-Training for Dataset 1:
| Gradient Boosting with CT | 10% of Data | 20% of Data | 30% of Data | 40% of Data | 50% of Data |
|---|---|---|---|---|---|
| Global Accuracy | 76.60 | 77.11 | 78.13 | 78.43 | 78.72 |
Figure below shows the comparison between the average global precision of the 2 training approaches (SL vs. SSL) for dataset 1.
Experiment 2 – SL vs SSL for Dataset 2
Average precision for models of experiment 2:
| Model | Accuracy | Error | # Objective | # Subjective | % Objective | % Subjective |
|---|---|---|---|---|---|---|
| Base Line | 63.50 | 36.50 | 635 | 365 | 100.00 | 100.00 |
| SVM Linear | 68.94 | 31.06 | 502 | 187 | 79.06 | 51.34 |
| SVM Radial | 72.52 | 27.48 | 503 | 222 | 79.18 | 60.93 |
| SVM Polynomial | 70.44 | 29.56 | 507 | 198 | 79.81 | 54.14 |
| SVM Sigmoid | 37.70 | 62.30 | 333 | 44 | 52.47 | 12.00 |
Gradient Boosting Accuracy with Co-Training for Dataset 2:
| Gradient Boosting with CT | 10% of Data | 20% of Data | 30% of Data | 40% of Data | 50% of Data |
|---|---|---|---|---|---|
| Global Accuracy | 63.00 | 67.29 | 68.21 | 73.46 | 74.40 |
Figure below shows the comparison between the average global precision of the 2 training approaches (SL vs. SSL) for dataset 2.
Technologies and Techniques
- R 3.5.1 x64
- RStudio - Version 1.1.383
- Supervised Learning (SL)
- Co-training
- TF-IDF
Contributing and Feedback
Any kind of feedback/criticism would be greatly appreciated (algorithm design, documentation, improvement ideas, spelling mistakes, etc…).
Authors
- Created by Segura Tinoco, Andrés and Cuevas Saavedra, Vladimir
- Created on July, 2018
License
This project is licensed under the terms of the MIT license.

